ELK Stack

ELK Stack
Debian ELK Stack (Elasticsearch, Logstash and Kibana) Installation and Configuration
Hello, in this article, I will explain the installation and configuration of ELK Stack on Debian-based Linux distributions.
What is ELK Stack ?
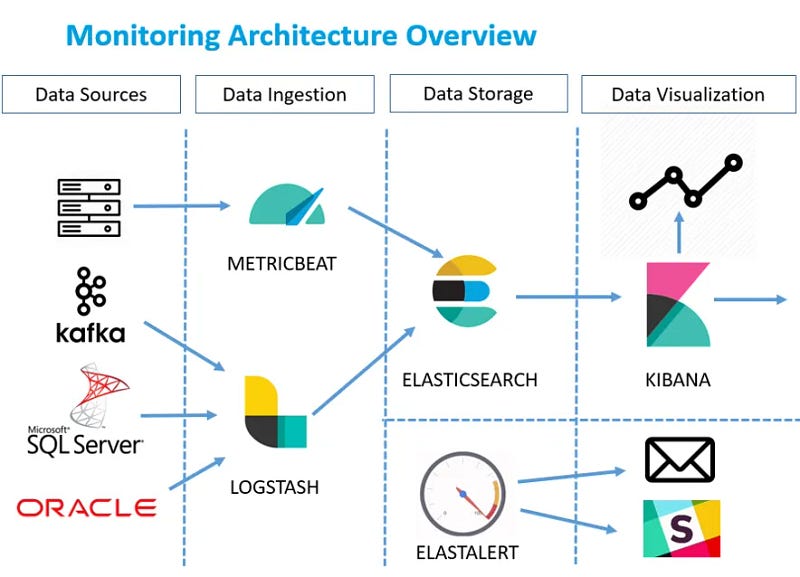
ELK Stack is an open source platform frequently used in log management and analysis. It consists of three main components that make up its name: Elasticsearch, Logstash and Kibana.

ELK Stack
- Elasticsearch: It is a search and analysis engine used to store, index and quickly search large amounts of structured and unstructured data. In addition to log data, it can also index data from various sources.
- Logstash: It is a tool that manages data collection, processing and transformation processes. It collects data from different sources (system logs, application logs, network traffic, etc.), filters, enriches it and sends it to Elasticsearch.
- Kibana: A tool used to visualize data stored in Elasticsearch. It enables drawing meaningful conclusions from data by creating interactive dashboards, graphs and maps.
Installation order of Elastic Stack products:
 1- Elasticsearch
 2- Kibana
 3- Logstash
First, we need to prepare the environment in which we will install. For this we need to have an operating system.
What is Debian?
Debian was started in 1993 and was prepared by volunteers in various parts of the world; GNU/Hurd is a completely free Linux distribution based on different kernel options like GNU/Linux. Some popular debian based linux distributions:
- Ubuntu
- PureOS
- antix
- Deep
- PopOS!
- MX Linux
- Linux Mint
- Kali Linux
- Pardus
We have listed some members of the Debian family here. Apart from this, you can also install the ELK stack on Windows, Macos or Redhat based or other independent Linux distributions. In this article, I will install on an ubuntu machine. However, the same installation steps are valid for other Debian-based distributions.
1- Preliminary Preparation
First, let's look at the information of the system we will install and make sure that the distribution is the latest version for security reasons.

Version information of the Ubuntu distribution I installed.
I named my current server "elastic" as the hostname and created an authorized user named "superman".
Then let's make updates to our system. Performing these updates before each installation allows us to minimize possible errors caused by dependencies.
sudo apt update && sudo apt upgrade

Package updates
Finally, we need to make sure that our machine has enough resources. So it must have enough disk, ram and CPU. This will vary depending on your needs.
2- Elasticsearch Installation
To install Elasticsearch, we first need to download the Debian package.

Downloading process of elasticsearch debian package with wget
wget https://artifacts.elastic.co/downloads/elasticsearch/elasticsearch-8.15.3-amd64.deb
We can download using the wget tool.
Then, let's perform the installation process with dpkg, which is the package installation tool of Debian. We need root authority for installation.
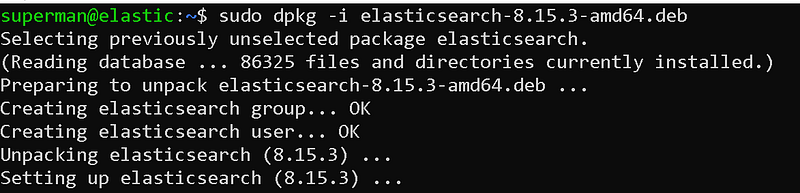
Elasticsearch installation
sudo dpkg -i elasticsearch-8.15.3-amd64.deb
At the end of the installation, it offers us suggestions on how to continue the installation.
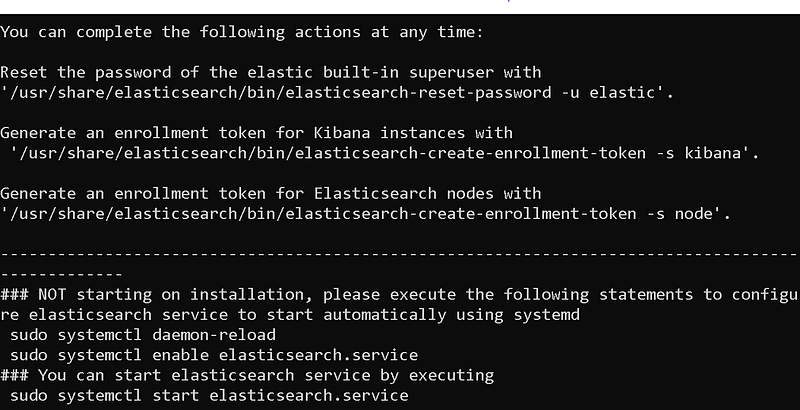
Post-installation steps
From here, let's continue with the post-installation steps. First, let's start our service.
sudo systemctl daemon-reload
sudo systemctl enable elasticsearch.service
sudo systemctl start elasticsearch.service
We can obtain information about the status of the service by using the journalctl command.
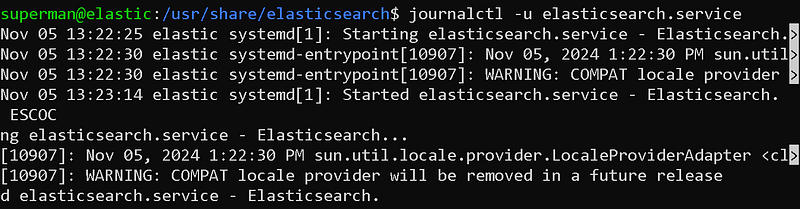
Service status review with journalctl
Now, the password of the user "elastic", which is the default authorized user that allows us to access the elasticsearch interface, is set.Let's reset it. Here we can give the password we want.
sudo /usr/share/elasticsearch/bin/elasticsearch-reset-password -u elastic -i
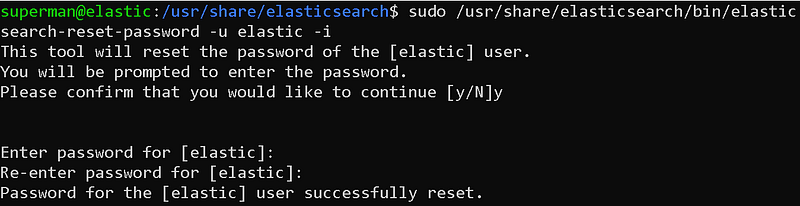
elastic user password reset
Now it is time to generate the token that we will use in the Kibana connection.
sudo /usr/share/elasticsearch/bin/elasticsearch-create-enrollment-token -s kibana
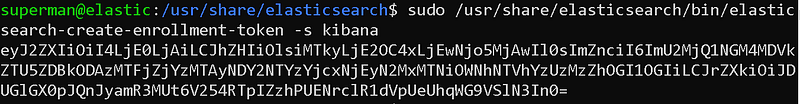
Generating tokens for kibana connection
We must store this token carefully. We will use it to connect to Kibana in the future.
Finally, we need to open the elasticsearch port on our system's firewall.
sudo ufw allow 9200
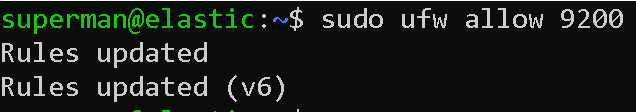
Firewall port opening process
Now our system broadcasts the elasticsearch service to the network it is located on. We can access it via browser.
https://
:9200

Access via browser
Here, you can access elasticsearch by entering elastic as the username and the password you determined in the previous steps as the password.
2- Kibana Installation
To install Kibana, we first need to download the Debian package.
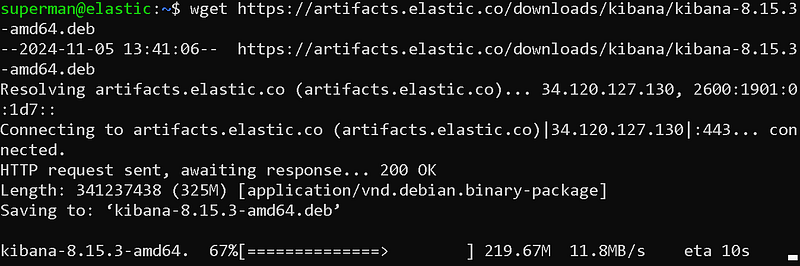
Downloading process of elasticsearch debian package with wget
wget https://artifacts.elastic.co/downloads/kibana/kibana-8.15.3-amd64.deb
We can download using the wget tool.
Then, let's perform the installation process with dpkg, which is the package installation tool of Debian. We need root authority for installation.

Kibana installation
sudo dpkg -i kibana-8.15.3-amd64.deb
After the installation is completed, we can start kibana configurations. To do this, we open Kibana's configuration file with nano.
sudo nano /etc/kibana/kibana.yml
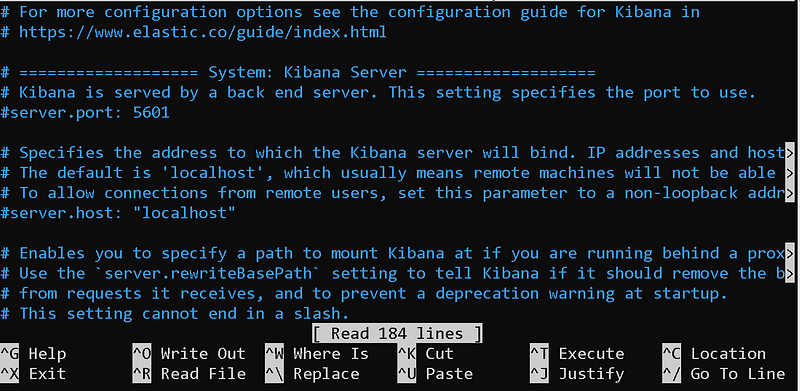
kibana.yml file
Here I will only show the areas that need to be changed.
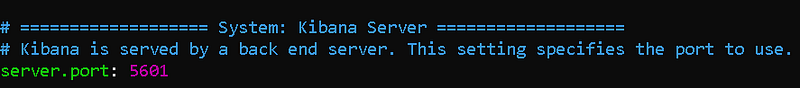
server.port
Delete the # sign in front of the server.port field and write the port you want the Kibana service to run on in quotes. By default it is 5601.

server.host
Delete the # sign in front of the server.host field and write the IP address of your own system in quotes.

server.name
Delete the # sign in front of the server.name field and write your own system's hostname in quotes. I wrote it because mine was "elastic".
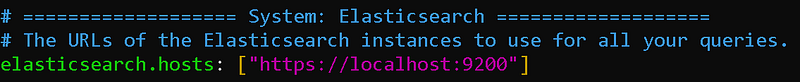
elasticsearch.hosts
The elasticsearch service that kibana will connect to. Since I installed this service on the same machine, localhost can remain. If it was a different host, I would have to write its IP. Also, let's not forget to change the initial protocol to "https".

elasticsearch token link
kibana offers 2 ways to authenticate the elasticsearch connection. One of these is verification with username and password, and the other is verification with the token we will use. If you remember, we created a token during the elasticsearch installation. We enter this token between quotation marks.

ssl.verification
Since the certificate used by elasticsearch is self-signed, it has not been verified by any authority. This causes us to receive an SSL verification error when connecting to Kibana. To avoid this error, we set the ssl.verification field to "none". Or you can install a verified ssl certificate.
That's basically all we need to configure. You can review Kibana's documentation to set other fields. I'm sticking with the default configurations for the rest.
Now let's start our service.
sudo systemctl daemon-reload
sudo systemctl enable kibana.service
sudo systemctl start kibana.service
We can obtain information about the status of the service by using the journalctl command.
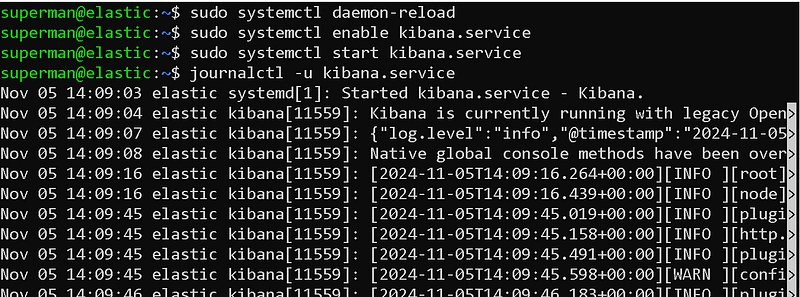
kibana service startthrowing away
Finally, we open the 5601 port used by Kibana through the system firewall.
sudo ufw allow 5601

Port Opening Process
You can now access the kibana panel via your browser.
https://
:5601/
It may take a while for Kibana to stand up.
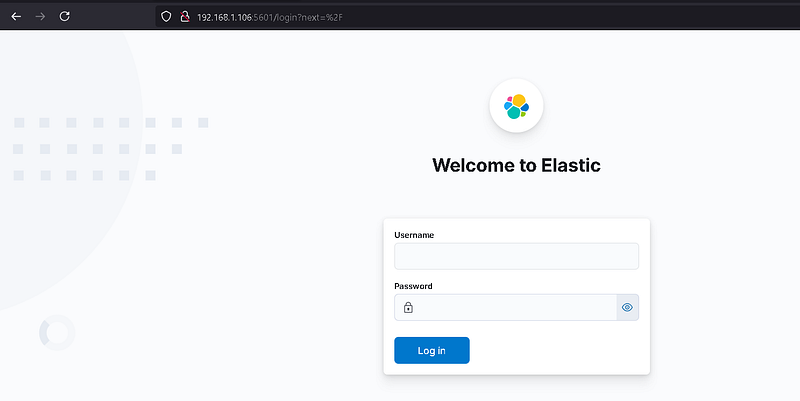
kibana panel
Our Kibana panel has appeared. You can log in to this panel with the "elastic" user. Let's continue the installations.
3- Logstash Installation
To install Logstash, we first need to download the Debian package.

Downloading logstash package with wget
wget https://artifacts.elastic.co/downloads/logstash/logstash-8.15.3-amd64.deb
Then, let's perform the installation process with dpkg, which is the package installation tool of Debian. We need root authority for installation.

logstash installation process
sudo dpkg -i logstash-8.15.3-amd64.deb
After the installation is completed, we can start configurations.
First, let's give the password to the logstash_system user for the elasticsearch connection. don't forget this password
sudo /usr/share/elasticsearch/bin/elasticsearch-reset-password -u logstash_system -i

logstash_system user password setting
Then let's open the logstashin configuration file and edit it.
sudo nano /etc/logstash/logstash.yml

logstash.yml file
Do not forget to enclose the string values we provide in this file in quotes.
Now we can start the logstash service.

starting logstash service
sudo systemctl daemon-reload
sudo systemctl enable logstash.service
sudo systemctl start logstash.service
Finally, we open the 5044 port, which is the default port of logstashin, in our system.
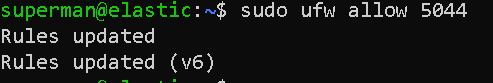
Port opening process
sudo ufw allow 5044
We cannot access Logstashe through a browser like elasticsearch or kibana. Because logstash receives and queues logs from port 5044. So it doesn't give any answer.
Let's configure our first pipeline!
/usr/share/logstash/bin/logstash -e 'input { stdin { } } output { stdout {} }'
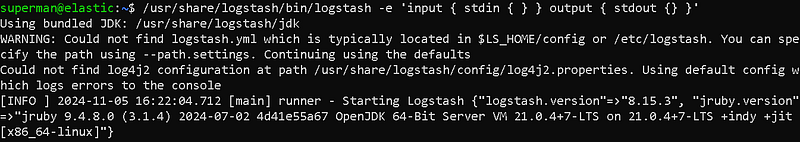
Creating a logstash pipeline

Ready for input
Our pipeline is listening and ready for logs coming to port 5044.
You can parse your logs by writing various parsers with logstash.
In this article, I mentioned the ELK stack installation. In my next article, I will talk about sending logs to ELK, agent installation and log parceling. You can follow me to be informed about the articles I publish.
ELK Stack Log Management and Analysis
Hello, in this article, I will talk about the log management of ELK Stack, which we installed in my last article, namely log collection, parsing and enrichment processes. How to Collect, Process and Send Logs with Logstash?
What is Log Management?
Log management is the process of collecting, storing, analyzing and managing all log records (logs) produced by a system or application. These logs contain important information about the operation of the system and are used in many areas such as troubleshooting, security analysis, and performance monitoring.
Log collection methods with ELK Stack (Elasticsearch, Logstash, Kibana):
- Syslog: With this protocol, which is common in UNIX-based systems, logs can be collected via Logstash or Beats.
- Beats: Provides different tools for log collection. Metricbeat collects performance metrics, while Winlogbeat collects Windows events. Heartbeat monitors the status of the servers. .Filebeat collects log files from file systems and sends this data to Logstash or Elasticsearch. Each requires separate installation.
- Agent Installation: Agents are installed on systems that are log sources (servers, network devices, etc.) and these agents send data to Logstash or Beats.
Agent Installation Advantages:
- Central Management: Provides a central point to collect and manage log data. This makes it easier to store and analyze log data in an organized manner.
- Real-Time Monitoring: Agents can monitor events in real-time and provide instant reporting. This allows detecting anomalies quickly.
- Customizability: Agents can be configured according to specific requirements. You can apply various rules and filters to collect and transform log data from different sources.
- Enhanced Security: Agents support encryption protocols to ensure secure transmission of log data.
- Performance Monitoring: Agents can be used to monitor system performance and detect performance issues.
Agent Installation Disadvantages:
- Resource Usage: Agents may consume resources on the systems where they are installed. This can cause performance issues, especially in high-density systems.
- Management Complexity: Managing multiple agents can be complex, especially in large-scale systems. Updating and managing each agent can be time-consuming.
- Security Risks: Misconfigured agents can cause security vulnerabilities. Therefore, it is important to configure and manage agents securely.
- Compatibility Issues: Compatibility issues may occur between different systems and platforms. Some agents may not have full functionality on certain systems.
In this article, we will send logs with beats and collect logs with logstash from a Linux system.
1- Logstash Configuration
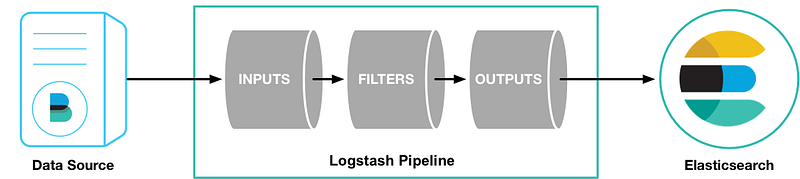
Logstash is easier to understand when you imagine it as a pipeline. At one end of this pipeline are inputs that represent data sources. As log records pass through the Logstash pipeline, they can be enriched, filtered or manipulated based on your needs. Ultimately, when they reach the end of the pipeline, Logstash can deliver these logs to configured destinations for storage or analysis.

Logstash Pipeline
To create this data processing pipeline, you can configure Logstash using a configuration file. A typical logstash configuration file:
input {
      plugin_name{...}
 }

filter {
     plugin_name{...}
}

out {
     plugin_name{...}
}
Now let's examine these components:
input: represents log sources such as files or endpoints.filter(optional): merges and transforms log records.output: destination to which the processed logs will be delivered.
These inputs, filters, and outputs need plug-ins to fulfill their roles. These plugins are the building blocks that power Logstash and enable it to perform a wide variety of tasks. Let's review these plugins to give you a better understanding of Logstash's capabilities.
Logstash input plugins
Logstash for inputs,Provides input plugins(https://www.elastic.co/guide/en/logstash/current/input-plugins.html) that can collect logs from various sources such as:
- HTTP: Retrieves logs via HTTP endpoints.
- Beats: Collects logs from the Beats framework.
- Redis: collects log records from a Redis instance.
- Unix: read logs through a Unix socket.
Logstash filter plugins
When you want to manipulate, enrich or replace logs, some of the filter plugins here can help you do so:
- JSON: Parses JSON logs.
- Grok: parses and structures log data.
- I18n: removes special characters from your log records.
- Geoip: adds geographic information.
Logstash output plugins
After processing the data, the following output plugins may be useful:
- WebSocket: forward logs to a WebSocket endpoint.
- S3: send log records to Amazon Simple Storage Service (Amazon S3).
- Syslog: forward logs to a Syslog server.
- Elasticsearch: pass log entries to Elasticsearch, which is part of the Elastic stack.
To set up the logstash pipeline, create a configuration file in the etc/logstash/conf.d directory.
sudo nano /etc/logstash/conf.d/logstash.conf
We will transfer logs with beats. Our configuration file for this is:
# Sample Logstash configuration for creating a simple
# Beats -> Logstash -> Elasticsearch pipeline.

input {
  beats {
    port => 5044
  }
}

filter {
  grok {
    # Match nginx headers
    match => {
      "message" => '%{IP:client_ip} - - \[%{HTTPDATE:access_time}\] "%{WORD:http_method} %{URIPATH:request_page} HTTP/%{NUMBER:http_version}" %{NUMBER:response_code} %{NUMBER:response_size} "-" "%{GREEDYDATA:user_agent}"'
    }
  }
  }

out {
  elasticsearch {
    hosts => ["https://<host-ip>:9200"]
    index => "filebeat-test-%{+YYYY.MM.dd}"
    ssl => true
    ssl_certificate_verification => false
    user => "elastic"
    password => "changeme"
  }
} beats { port => 5044 } } filter { grok { # Match nginx headers match => { "message" => '%{IP:client_ip} - - \[%{HTTPDATE:access_time}\] "%{WORD:http_method} %{URIPATH:request_page} HTTP/%{NUMBER:http_version}" %{NUMBER:response_code} %{NUMBER:response_size} "-" "%{GREEDYDATA:user_agent}"' } } } output { elasticsearch { hosts => ["https://192.168.1.100:9200"] index => "filebeat-test-%{+YYYY.MM.dd}" ssl => true ssl_certificate_verification => false user => "elastic" password => "123456" } }
In this file, you need to write the password of your own "elastic" user in the password field.
I used the grok plugin as a filter on Logstash. grok is a very good parser plugin. We will be parsing our incoming logs on Logstash with the grok plugin.
Now change ownership of directory /usr/share/logstash/data to user logstash:

Changing ownership of Logstash data directory
sudo chown -R logstash:logstash /usr/share/logstash/data
Now start Logstash by passing the path to the configuration file:
sudo -u logstash /usr/share/logstash/bin/logstash -f /etc/logstash/conf.d/logstash.conf
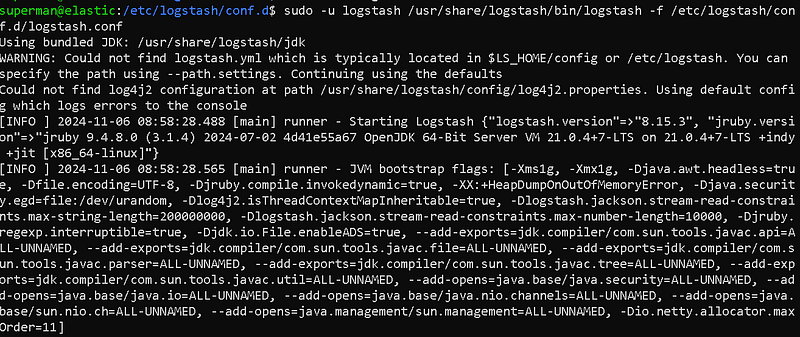
Starting logstashi
When you start it with the Logstash configuration file, if there are no errors, you will receive a message that the pipeline is listening and ready.
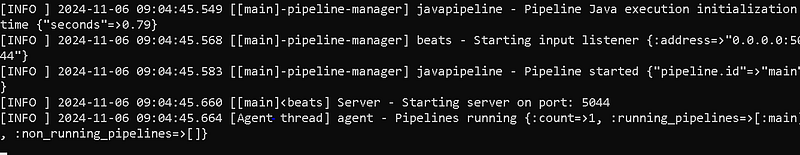
Pipeline listening

Logstash Service Status
Now our pipilen is ready. Our service is up and running. We can move on to the next step.
2- Beats Configuration
We will use the beats tool to send logs via clients to our Logstash service running on our ELK server. By installing beats on client systems, we can send logs from the systems.
Each Beat is a separately installable product:
As you can see, there are many beat products. Let's use the filebeat product to send the log files in our system.
We start the installation on our client system. I will continue with my same system. The server on which I installed my ELK system will also be my client.
wget https://artifacts.elastic.co/downloads/beats/filebeat/filebeat-8.15.3-amd64.deb
sudo dpkg -i filebeat-8.15.3-amd64.deb

Filebeat installation
After downloading and installing Filebeat, we proceed to the configuration process.
sudo nano /etc/filebeat/filebeat.yml

Elasticsearch Output
Since we will direct our output to logstashe, we close the elasticsearch section with a square sign.

Logstash Output
In the Logstash section, we enter the IP and port number of our Logstash server.
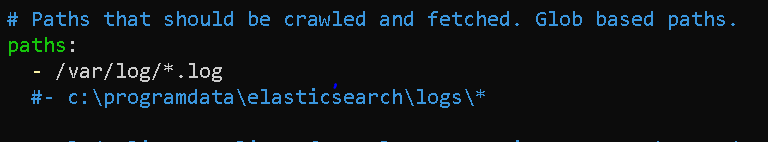
Log Collection Configuration
In the Paths section, we can configure the logs that our beat will collect. By default, it collects log files under the /var/log/ directory. For more, we can add the logs of important services (WEB, DNS, DHCP, etc.) running on our server to this section.
When our configuration settings are completed, we can save the file and exit.
Now it's time to start our filebeat.
sudo systemctl daemon-reload
sudo systemctl enable filebeat.service
sudo systemctl start filebeat.service
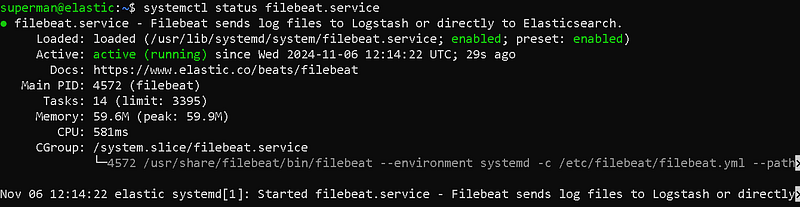
Filebeat Service Status
We have now completed our filebeat configuration and started our service. Our service is up and running.
You can install and configure other beats products in a similar way.
3- Kibana Configuration
We have completed our Logstash and Filebeat installations. Now let's open our kibana interface. Then let's enter the elasticsearch section. Let's check if our index has arrived in the Indicies area.

Kibana Interface
We can see our incoming index in this interface. Now let's go to the "Discover" section.
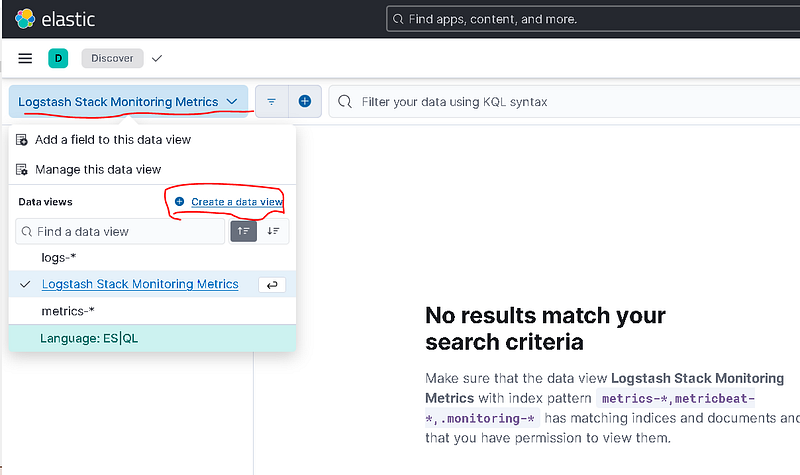
Discover Panel
We will create a new data view by clicking the Create Data View button.

Creating a Data View
Give it a name and select the index pattern, you may want to name it filebeat* as you want the filebeat directory despite the time it was created, if you select filebat-test-2023.10.03* only one directory will be loaded and the new directory will not be able to receive real time data as it will be under different data. Therefore, you should avoid it.
After saving the Data View, logs should appear in the discover panel. If it hasn't arrived, there is a problem.

Discover Panel
We can now perform log search from this panel.
In this article, we added a log source to our ELK system. We parsed the logs and sent them to elasticsearch. We made the necessary configurations in the Kibana interface.
ELK Stack Rule Writing and Alerting
Hello, in this article, I will talk about rule writing, that is, warnings indicating security violations, and alerting operations of ELK Stack, which we installed in my last article. ELK Stack (Elasticsearch, Logstash, Kibana) facilitates rule writing and alerting operations, data analysis and management.
What are IoC and IoAÂ ?
IoC (Indicators of Compromise) and IoA (Indicators of Attack) are important concepts in the field of cyber security and are used in the detection and analysis of attacks.
These markers are critical in detecting and stopping an attack. While IoC detects that an attack has occurred, IoA helps understand the methods and objectives of the attack.
Indicators of Compromise (IoC)
IoC are indicators that indicate the presence of malicious activities or attacks on a system. These markers help detect that an attack or breach has occurred. Examples of IoC may include:
- Malware Signatures: Signatures of known malware.
- IP Addresses: IP addresses linked to malicious activity.
- Domain Addresses: Domain names associated with malicious activities.
- File Hash Values: Hash values ​​of malicious files.
Indicators of Attack (IoA)
IoA are indicators that indicate that an attack is being carried out or is in the process of occurring. IoA helps understand the methodology of the attack and the attacker's objectives from a broader perspective. Examples of IoA may include:
- Strange User Behavior: User behavior that differs from normal, such as unauthorized data access attempts.
- System Changes: Unexpected system configuration changes.
- Command and Control Traffic: Attacker's attempts to communicate with the system remotely.
- File System Changes: Unexpected file additions or deletions.
- Exploiting Software Vulnerabilities: Attempts to exploit known software vulnerabilities.
Elastalert
Elastalert allows you to create alerts when certain conditions occur in Elasticsearch. Elastalert can be configured with specific filters and conditions, and alerts can be notified across various channels such as email, webhook, Slack. see: https://elastalert.readthedocs.io/en/latest/elastalert.html
ELK Stack
ElastAlert is a simple framework for alerting about anomalies, spikes, or other interesting patterns from data in Elasticsearch.
If you are writing data to Elasticsearch in real time and want to receive alerts when this data matches certain patterns, ElastAlert is the tool for you.
Kibana provides an easy interface to create and manage alerts in Elasticsearch. In Kibana, you can create new alerts and manage existing alerts in the alerts and actions section.
Alerting
Alerts mean being notified automatically when certain conditions or anomalies are detected. Alerts in Elasticsearch optimize data analysis and management processes.
Rule writing ensures that certain actions are taken when certain conditions are met. APIs and tools used for rule writing in Elasticsearch include Elastalert and Kibana.
Kibana Warnings
You can follow the steps below to create and manage alerts in Kibana:
- Login to Kibana: Log in to Kibana and go to the administration section.
- Go to Alerts and Actions Section: You can create new alerts in the Alerts and actions section.
- Configure Alert: Configure the alert with specific filters and conditions.
- Link Actions: Link alerts to various channels such as email, webhook, Slack.
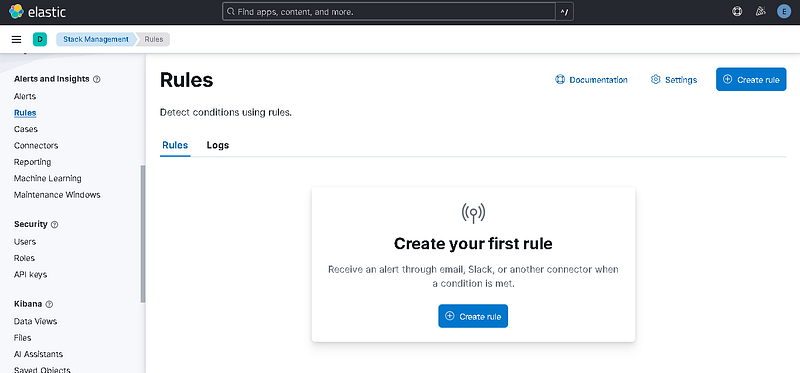
Rules Menu

Rule Type

Create Rule
For example, we activated the CPU usage rule. If the CPU Usage rate on the machine exceeds 10%, a warning will be generated.
You can write all kinds of rules through this menu.
The Changing Face of Threat-Oriented Defense Strategy
In the field of cyber security, threat-informed defense strategy replaces traditional signature-based detection methods.It has become increasingly important in a period when it remains sweatless. While traditional approaches focus on known malware types, modern attackers are constantly changing their tactics and techniques, trying to bypass defenses. At this point, the MITER ATT&CK (Adversarial Tactics, Techniques, and Common Knowledge) framework has become a transformative resource for the cybersecurity world.
MITER ATT&CK is a globally accepted knowledge base that structures the lifecycle of an attack into tactics (the attacker's goals) and techniques (the methods he uses to achieve those goals). This framework enables the creation of a more resilient defense mechanism by focusing on the behavioral patterns of attackers rather than the tools they use. Rather than blocking a specific software used by an attacker, targeting the behavior of that software at stages such as Discovery, Execution or Privilege Escalation makes defense strategies more comprehensive and flexible. This approach allows security teams to understand attacks in a more holistic context, conduct threat hunting, and respond to incidents more effectively. Additionally, ATT&CK has become a critical tool for assessing security maturity by creating a common language about threats among different stakeholders, such as the security operations center (SOC), threat intelligence, and executives.
ELK Stack: The Open Source Heart of the Modern SOC
ELK Stack is an open source and extremely popular platform used for log management and analysis. It consists of three main components, Elasticsearch, Logstash and Kibana, and they work together to transform raw log data into actionable security information. As a distributed and RESTful search and analysis engine, Elasticsearch stores chunked log data as JSON documents and makes it instantly queryable. Thanks to its horizontal scalability architecture, it can easily manage high volumes of data and query load.
Logstash is at the center of the data processing pipeline, taking data from various sources (files, system logs, databases) and processing, transforming and enriching them. This process consists of three main stages: inputs, filters and outputs. Filters make data more meaningful by performing actions such as separating unstructured data into meaningful fields (using Grok patterns) and adding geolocation information based on IP addresses. Finally, Kibana is an intuitive web interface for visualizing data stored in Elasticsearch. Users can create interactive dashboards, apply filters, and search raw log data. Modern versions of Kibana also include machine learning-based anomaly detection and alerting features.
ELK Stack serves a variety of use cases such as log management, infrastructure monitoring, application troubleshooting and security analysis. However, it should be noted that this platform is not a full-fledged "out of the box" SIEM (Security Information and Event Management) solution. Although ELK provides log collection, processing, storage, and query capabilities, it requires additional components or custom configurations for features such as complex event correlation, built-in alert mechanisms, and automatic incident response capabilities. Therefore, the purpose of this report is to provide a structured rule set and integration guide that uses ELK's strengths to close these gaps and make sense of threats within the MITER ATT&CK framework.
Basic Configurations and Resources Required for the Ruleset
The basis of creating a MITER ATT&CK-focused rule set on an ELK infrastructure lies in collecting the correct log sources, standardizing this data and processing it efficiently. This section details these basic configurations that are essential to maximize detection capabilities.
Map of Log Resource Requirements
The most important log sources required to detect an attacker's behavior vary depending on the environment in which the attack occurs. Different data sources are vital for each of the MITER ATT&CK Enterprise, Mobile and ICS domains.
Mandatory Logs for Windows Systems:
- Sysmon: Sysmon (System Monitor) is a Windows system service that captures critical security events such as process creation, network connections, and file access on the system through Windows Event Logs. Especially Sysmon's Event ID 1 (Process creation) event is a much more valuable resource than Windows' default security logs for detecting techniques such as T1059 (Command and Script Interpreter) and T1087 (Account Discovery) because it provides rich data such as a process's full command line arguments, host process information, and hash values.
- Windows Security Event Logs: In addition to Sysmon, Windows' built-in security logs record important events related to account management. For example, creating, deleting, or adding/removing a user account to a group provides critical data to detect behaviors that attackers use to establish persistence or escalate privilege.
Mandatory Logs for Linux Systems:
- Auditd: In Linux, the
auditdservice is used to monitor kernel-level activities such as system calls, file accesses, and process creation.Auditdlogs are an indispensable source in detecting the behavior of attackers (e.g. commands such asnet.exe) after infiltrating a system.FilebeatandAuditd Managerintegrations allow these logs to be easily transferred to ELK.
Network and Other Resources:
- Network Flow Logs: Network traffic flow logs (e.g. NetFlow) or data collected through tools such as
Packetbeatare vital to detect reconnaissance tactics such as T1046 (Network Service Discovery). These logs are used to identify abnormal connection attempts (port scanning) from one source to multiple destinations or ports. - Insight: The effectiveness of the ruleset depends not only on the availability of log sources, but also on the quality of the data collected. Just collecting logs is not enough; Logs must contain enriched information (command line arguments, user names, main processes) that clearly reveals the attacker's purpose and actions. This is a critical element to maximize detection capabilities.
Data Normalization: Standardization with Elastic Common Schema (ECS)
Different platforms and devices produce log data, each in a unique format. This makes analyzing log data, correlating it, and creating threat hunting queries extremely complex. Elastic Common Schema (ECS) is an open source specification developed to solve this problem, defining a standard set of fields for use when storing event data in Elasticsearch.
ECS standardizes data by providing common field names (such as process.name, source.ip, destination.port) for different log types (e.g. Windows events, Linux processes, network traffic). This standardization facilitates data correlation between log sources and makes it possible to pull data from multiple sources with a single query. This eliminates the burden for security analysts to write separate queries for each log format and speeds up discovery processes.
A security team saves time with ECS-compliant data when hunting for threats or performing root cause analysis of an incident. The attacker can understand much more quickly how the process started in one system connects to another system over the network or which files it changes, by associating data from different log sources with a single standard query. This significantly reduces incident response teams' time to detect (MTTD) and time to respond (MTTR) to an incident.
Data Processing Pipelines: Logstash and Ingest Node
Raw log data must be processed and enriched before making it suitable for detection rules. ELK Stack has two primary mechanisms for this process: Logstash filters and Elasticsearch Ingest Node pipelines. Each has its own advantages and ideal usage scenarios.
- Logstash Filters: Logstash has a flexible architecture consisting of input, filter and output stages. In particular,
Grokfilters are very powerful at separating unstructured text-based logs into meaningful areas through predefined patterns. These filters are ideal for applying enrichment operations to logs, such as geolocation information (geoip), field transformation (mutate) or conditional processing (if). Logstash acts as a middleware in the data flow, allowing complex processing of the data before it is sent to Elasticsearch. - Elasticsearch Ingest Node Pipelines: Ingest Node runs within the Elasticsearch cluster andIt is a feature that performs simple transformations right before the data is indexed. Ingest Node, which targets lighter and simpler operations than Logstash, is especially suitable for performing basic transformations on data with processors such as
grokorset. These pipelines, which can be automatically configured through integrations, can simplify the architecture in scenarios that do not require the complexity of Logstash.
Making a strategic choice between both methods is important for the performance and scalability of the infrastructure. Sources indicate that Logstash is better suited for complex data transformation, enrichment, different input sources and multiple output targets, while Ingest Node simplifies the architecture for simpler processing needs. While using Logstash may be preferable in situations with heavy log volume or a complex data processing requirement, for simpler 'Grok' or field conversion operations, Ingest Node offers the potential to simplify the architecture and reduce management burden.
Rules Format and Metadata Standards
While MITER creates a rule set focused on ATT&CK, ensuring that each rule complies with a specific standard and structure increases the manageability of the rule set and its usability for the security team. This section describes the basic components of the rule structure and proper methods of association with MITER ATT&CK.
Rule Configuration Methodology
Each rule should contain key components to effectively detect threats and provide actionable information to security teams. These components are:
- Rule ID (
rule_id): There must be a unique identifier for each rule. This identity makes it easy to track, update, and report on the rule throughout its lifecycle. For example, it is recommended to use a descriptive ID such asPS-Encoded-Cmd-Detection-001. - Severity (
severity): It is a value that shows the potential impact of the event triggered by the rule. Typically, ratings such asCritical,High,MediumorLoware used. This helps security analysts determine which alarms they should prioritize. - Description (
description): It is the text that clearly explains what the rule detects, why it is important and what goal the attacker is trying to achieve. A well-written description speeds up the triage phase of an incident.
MITER ATT&CK Labeling
One of the most important elements of the rule set is that each rule is accurately labeled with the MITER ATT&CK tactic and technique it identifies. This tagging puts raw log data into the context of the attack, allowing security teams to more quickly understand the intent behind an incident.
When creating a rule in Kibana, it is possible to add these tags via custom fields such as mitre.tactic and mitre.technique_id. For example, the JSON output of a rule might look like this:
{
  "mitre.technique_id": "T1059",
  "mitre.tactic": "execution"
}
These tags act as a bridge for security analysts, allowing them to instantly understand what the attacker is trying to do (tactics) and what method (technique) they are using when they see an alarm. This information speeds up the incident response process and allows for a holistic picture of the defense strategy.
Rule Examples and Identification According to MITER ATT&CK Tactics
In this section, concrete and applicable rule examples are presented for selected MITER ATT&CK techniques under Reconnaissance and Execution tactics. These examples are created based on data from different log sources and explain both the rule logic and the relevant context.
Tactic: Execution â€" TA0002
This tactic involves attackers attempting to run their own code or commands on a system.
Technical: T1059 Command and Script Interpreter
Attackers tend to execute code on the system using command and script interpreters (e.g., PowerShell, Bash, cmd.exe), which are built-in operating system tools. This technique is one of the most frequently used methods in attack campaigns. PowerShell is frequently abused, especially to bypass defense mechanisms, run malicious payloads in memory, and obfuscate complex commands.
Rule Example 1: Suspicious PowerShell Commands Detected (T1059.001)
This rule detects when PowerShell is run with the --EncodedCommand parameter, which is often used to hide commands. This type of codesHowever, it is often used to avoid static analysis by security solutions for illegitimate scripts.
- Rule ID:
PS-Encoded-Cmd-Detection-001 - Severity:
High - Description: "Detects running PowerShell with the
--EncodedCommandparameter. This is often used by malware to hide commands and bypass security solutions." - MITRE ATT&CK Tag:
mitre.tactic: execution,mitre.technique_id: T1059, T1059.001 - Log Source: The ideal log source for determining the rule is Event ID 1 (Process creation) logs produced by Sysmon or Windows PowerShell Script Block Logging. These resources record the full command line arguments in detail.
- Rule Logic:
- Kibana EQL (Event Query Language) Query:
- process where process.name == "powershell.exe" and process.command_line : "*EncodedCommand*"
- This query finds all events with
powershell.exein theprocess.namefield and containing theEncodedCommandkeyword in theprocess.command_linefield. - False Positive Analysis: Legitimate administrative scripts can also sometimes encode and execute complex or sensitive commands. In such cases, rule noise can be reduced by creating exception lists for known and trusted management processes or IP addresses.
Rule Example 2: Deleting Shadow Copies with vssadmin.exe (T1490)
Although this technique is associated with the 'Impact' tactic, it is also directly related to the 'Execution' tactic as it starts with an attacker running a built-in Windows tool such as 'vssadmin.exe'. This rule detects deletion of shadow copies on the system, revealing threats to prevent data recovery.
- Rule ID:
VssAdmin-Shadow-Delete-002 - Severity:
Critical - Description: "Detects deletion of shadow copies using
vssadmin.exeto prevent system integrity and data recovery." - MITRE ATT&CK Tag:
mitre.tactic: impact,mitre.technique_id: T1490 - Log Source: Although Sysmon Event ID 1 (Process creation) is the best source, Windows Security Event Logs can also be used.
- Rule Logic:
- Kibana Custom Query (KQL):
- event.action:"Process Create (rule: ProcessCreate)" and process.name:"vssadmin.exe" and process.args:("delete" and "shadows")
- This query searches for the execution of the
vssadmin.exeprocess with thedeleteandshadowsarguments in data collected withwinlogbeat, such as Sysmon logs. Since legitimate use of this command is extremely rare, this rule is expected to produce a high-confidence alarm when triggered.
Tactic: Discovery (Discovery â€" TA0007)
This tactic involves attackers trying to gather information about the environment after entering a network.
Technique: T1087 Account Discovery
Attackers may attempt to enumerate local or domain accounts to find valid user accounts that they can use for privilege escalation or lateral movement.
Rule Example 1: Account Discovery with net.exe (T1087)
Windows' built-in net.exe tool is often used to list accounts and groups.
- Rule ID:
Net-User-Recon-003 - Severity:
Moderate - Description: "Detects the listing of local or domain accounts using Windows' built-in
net.exetool." - MITRE ATT&CK Tag:
mitre.tactic: discovery,mitre.technique_id: T1087 - Log Source: Sysmon Event ID 1, Windows Security Event Logs.
- Rule Logic:
- Kibana EQL Query:
- process where (process.name == "net.exe" or process.name == "net1.exe") and process.command_line: ("user" or "users")
- This query captures events where
net.exeornet1.exeprocesses are run withuserorusersarguments. - False Positive Analysis: System administrators can use these commands for routine tasks. Therefore, the rule may need to be used with additional context information such as
process.parent_nameor treated as a time window-based threshold rule.
Technical: T1046 Network Service Discovery
Attackers perform port scanning to find potentially vulnerable services and open ports on the network.
Rule Example 2: Network Service Discovery (T1046)
This rule detects suspicious connection attempts (port scanning) from a single source to multiple destinations or ports.
- Rule ID:
Port-Scan-Detection-004 - Severity:
Moderate - Definition: "From a source, for a short timedetects suspicious connection attempts (port scanning) to multiple targets or ports in the slot."
- MITRE ATT&CK Tag:
mitre.tactic: discovery,mitre.technique_id: T1046 - Log Source: Network flow logs, firewall logs collected with
PacketbeatorFilebeat. - Rule Logic:
- Kibana Threshold Rule:
- Index:
packetbeat-* - Aggregated on:
source.ip - Field to count:
destination.port - Threshold:
unique_count(destination.port) > 20within1 minute - This rule detects cases that exceed a threshold by counting connection attempts from a single source IP address (
source.ip) to more than 20 different destination ports (destination.port) within a minute. - False Positive Analysis: Load balancers, internal network scanning tools, or routine tests in development environments can trigger this rule. Therefore, it is necessary to create exception lists for known IP ranges or legitimate scanning tools.
Rules Development Approach for Mobile and ICS Environments
The flexibility of the ELK Stack enables threat detection not only for traditional Enterprise environments, but also for the more niche Mobile and ICS (Industrial Control Systems) domains.
Mobile Environments
The MITER ATT&CK for Mobile matrix includes tactics and techniques specific to Android and iOS platforms. Detecting mobile threats requires a different approach than traditional endpoint logging.
- Log Sources: Mobile threats are often detected by in-app behavior or logs related to the device itself. Application developers can send logs directly to Logstash using logging libraries such as
swift-log-elk. Additionally, Android'slogcattool can be used to monitor device logs via theadbcommand. Logs provided by Mobile Device Management (MDM) solutions are also a valuable resource for these analyses. - Rule Example (Theoretical): An attempt to access sensitive files (
/etc/passwd) on a rooted Android device can be detected by looking for a specific process and file path combination in thelogcatlogs.
ICS (Industrial Control Systems) Environments
MITER ATT&CK for ICS is specifically designed to model attacks targeting industrial processes. The biggest challenge in ICS environments is the processing and standardization of logs from proprietary industrial protocols (Modbus, OPC, PROFINET), unlike standard IT logs.
- Log Sources: In addition to standard IT logs, logs from protocols specific to OT environments are vital. These logs are usually collected in the form of Windows Event Logs, text files or databases.
- Rule Example (Theoretical): Unauthorized change of a PLC's operating mode (
Run->Program) or unusual collection of data over the OPC protocol can be detected by looking for a specific event pattern in the ICS logs.
Integration and Ruleset Validation
In order for the created rule set to be functional and reliable, it must be correctly integrated into the ELK Stack and its effectiveness must be tested regularly.
Uploading the Rule Set to ELK Stack
There are multiple ways to integrate rules into the ELK Stack. The most modern and manageable approach is to use Kibana's built-in Security application and APIs.
- Kibana Security App: New rules can be created via the visual interface from Kibana's 'Security > Detections' section. This interface supports different types of rules, such as threat intelligence integration (
Indicator match) or correlation rules. - Detection as Code (DaC): Ideal for larger teams and automation processes, this approach allows rules to be stored in a code repository (such as
elastic/detection-rules) in the form ofTOMLorJSONfiles and automatically loaded into Kibana via the API. This method facilitates versioning of rules, integration into CI/CD processes, and intra-team collaboration. - Data Processing Integrations: According to the rule logic, Logstash pipelines or Ingest Node pipelines can be used to prepare the log data in the correct format. Logstash can perform in-depth transformations on data with complex filters (
grok,mutate,geoip). Elasticsearch Ingest Node is used for simpler operations.
Testing the Ruleset
To understand the potential of a rule set, it is not enough to know theoretically what it detects.is the province. It is vital to verify how effective the rule is in a real attack scenario. Atomic Red Team is an open source library of simple, isolated tests that emulate MITER ATT&CK techniques for this purpose.
- Test Environment Preparation: First, an isolated test machine (VM) should be set up as a copy of the production environment. Necessary logging tools such as
Sysmonand agents that send logs to ELK (e.g.Winlogbeat) must be running on this machine. - Selection and Application of the Test: Tests corresponding to the MITER ATT&CK technique (such as
T1059) to be tested are selected from theAtomic Red Teamlibrary. These tests are run with a tool such as 'Invoke-AtomicRedTeam'. - Verification and Improvement: After the test is run, the logs are examined in Kibana to verify whether the created rule produces the expected alarm. If the rule does not fire or produces too many false positives, improvement is made by reviewing the rule logic or the log sources used. This is a feedback loop that ensures the ruleset remains constantly updated and effective.
Sample MITER ATT&CK Rule List
Rule NameRule Logic (EQL/Threshold)SeverityDefinitionMITRE TacticMITRE Technical IDPS-Encoded-Cmd-Detection-001process where process.name == "powershell.exe" and process.command_line : "*EncodedCommand*"HighDetect the execution of PowerShell with the --EncodedCommand parameter DiscoveryT1059.001VssAdmin-Shadow-Delete-002process where process.name : "vssadmin.exe" and process.args : "delete" and process.args : "shadows"CriticalDetects deletion of shadow copies with vssadmin.exe.EffectT1490Net-User-Recon-003process where (process.name == "net.exe" or process.name == "net1.exe") and process.command_line: ("user" or "users")MediumDetects account discovery activity using the net.exe tool.DiscoveryT1087Port-Scan-Detection-004count(destination.port) by source.ip > 20 in 1mMediumConnection from a single IP to many different ports Detects attempts.DiscoveryT1046
Conclusion: Guide for Teams on Ruleset Usage and Further Reading
This report provides a detailed roadmap on the process of creating and managing a comprehensive incident detection ruleset based on the MITER ATT&CK framework on the ELK Stack. The findings reveal some key takeaways and best practices for cybersecurity teams that will use this ruleset.
Best Practices:
- Prioritizing Threats: Identifying the most critical MITER ATT&CK tactics and techniques based on the organization's risk profile and threat intelligence creates a more focused and efficient defense strategy rather than activating all the rules.
- Continuous Improvement: A ruleset is not a "create once and forget" resource. It should be tested and improved regularly for new threats, false positives, and changing infrastructure conditions. This continuous cycle is an approach that matures defensive capabilities.
- Intra-Team Collaboration: Red and Blue teams collaborating is the most effective method to test and improve the effectiveness of the ruleset against realistic attack scenarios.
Future Recommendations:
- Machine Learning (ML) Integration: Using ELK Stack's machine learning capabilities, it is possible to create rules that learn normal user and system behavior and detect abnormal deviations. This provides a huge advantage in catching new threats, especially those without known signatures.
- Threat Intelligence Integration:
Indicator Matchrules can be created by integrating threat intelligence feeds (IoCs) directly into the ELK Stack. This enables rapid detection and alerting mechanisms against known malicious IPs, domains or file hashes. - Automated Response: As an advanced integration, combining detection rules with a SOAR (Security Orchestration, Automation and Response) platform can enable automatic response to alarms. For example, when a suspicious process is detected, automatic intervention actions can be taken, such as isolating the relevant host from the network or suspending the user's account.