Security Onion for Security Analysts

Security Onion for Security Analysts
What is Security Onion?
Security Onion is an open source security platform and was developed by cybersecurity experts. Essentially, it offers functions such as network visibility, computer visibility, intrusion detection, log management, and event management.
Main Features:
- Network Visibility: Monitors network traffic to detect security threats. It identifies malicious or anomalous traffic using tools like Suricata and Zeek.
- Host Visibility: With Elastic Agent, collects data from servers and workstations, performs live queries and provides centralized management.
- Intrusion Detection: Detects known malicious activities by monitoring network traffic.
- Log Management: All data flows into Elasticsearch and can be used for analysis and reporting.
- Incident Management: Provides an interface to track and manage security incidents.
Security Onion helps cybersecurity analysts detect threats faster and better understand events in their networks.
Main Components:
- Suricata: It is an intrusion detection and prevention system that monitors network traffic and detects malicious activities.
- Zeek (formerly Bro): It is a framework that analyzes network traffic and provides in-depth information about security events.
- Elastic Stack: Consists of Elasticsearch, Logstash and Kibana; It is used for storing, processing and visualizing data.
- Wazuh: It is a security monitoring tool that provides log analysis, intrusion detection, and compliance monitoring.
- CyberChef: It is a web application used for data transformations and analysis.
Open Source Security Analysis Platform
Security Onion is a free and open source Linux distribution developed for cybersecurity analysts. Launched by Doug Burks in 2008, this project offers threat hunting, network security monitoring (NSM) and log management in a single integrated platform. Its purpose is to detect and analyze attacks by providing full visibility over network traffic and system logs. As stated in the official description, Security Onion is described as a platform for "threat hunting, enterprise security monitoring and log management." It brings together a wide range of data sources such as IDS/IPS alerts, protocol metadata, full packet capture and endpoint telemetry. Thus, SOC teams can manage security events in a central console and perform automatic and manual analysis. For example, thanks to the network visibility provided by Security Onion, signature-based attack detection is performed with Suricata and network protocol analyzes are performed with Zeek; Thanks to host visibility, server and end computer activities are monitored with tools such as Elastic Agent/​osquery. All of this allows analysts to replay and dive deeper into malicious traffic. In addition, the platform is open source and free, allowing comprehensive network security management at a lower cost.
Security Onion
Architecture (Modular Components, Deployment Options)
Security Onion has a flexible and modular architecture. Standalone installation mode; It offers a simple structure where all components run on a single server. This mode is suitable for testing, laboratory or small environments. In standalone mode, Elastic Agents collect sensor data, send it to Logstash, from there it is put into the Redis queue and indexed to Elasticsearch with a second Logstash line. In this setup, both network (Zeek, Suricata) and endpoint (Windows Event Log, Sysmon, etc.) logs are collected and fed to a central ELK cluster. Distributed installation offers much higher scalability: It consists of a manager node, one or more sensor (forward) nodes and one or more search nodes.
- Admin node: SOC UI (Kibana based) runs here. The Elasticsearch index manager includes Logstash and Elasticsearch components. Users connect to this node as analysts and access data through queries[9]. (Separate search nodes are required for the admin node, otherwise logs may get stuck in the queue[10].)
- Search nodes: The administrator listens to the Redis queue coming from the node and processes and indexes the logs[11]. Search nodes respond to queries from the master node so that large data volumes can be processed in parallel.
- Sensor (Forward) nodes: Captures network traffic and performs analysis with Suricata and Zeek; They forward alerts and metadata to Logstash on the admin node[12]. They also do full packet capture (PCAP) with Stenographer and keep this data themselves. Elastic Agent is installed here and also sends Windows/Syslog data[12].
- Receiver nodes: Optional, provides redundancy by duplicating the log line coming to the administrator. It offers an additional layer of data streaming by running Logstash and Redis; Thus, even when the manager node is not active, the log queue continues to process without being clogged[13].
Additionally, Import and Evaluation modes offer simple test scenarios for beginners (e.g. pcap file or sniffing on a single machine). The Desktop node type provides an interface experience by offering the Security Onion desktop environment. Thus, the desired deployment scenario can be easily selected with the setup wizard. The distributed architecture can be expanded by adding new search or sensor nodes as needed. The entire architecture is driven by Docker-based containers; Current versions use a containerized infrastructure based on Oracle Linux 9.
Integrated Tools and Components
Security Onion combines numerous open source security tools. Prominent among these tools are:
- Suricata: Signature-based network-based IDS/IPS solution. Detects malicious packets and generates alerts. It can also perform full packet capture and network traffic analysis.
- Zeek : Network protocol analysis engine. HTTP, DNS, SSH etc. Records metadata of protocols and abnormal activities.
- Stenographer: Full packet (PCAP) capture tool. Securely saves summaries of network traffic and raw data. Analysts can play back PCAPs (like Wireshark).
- Strelka: File analysis engine. Opens file objects exposed by Zeek or Suricata and analyzes their contents (YARA scan, etc.).
- Kibana / ELK Stack: Central log management and visualization is provided via Elasticsearch, Logstash and Kibana. All network and endpoint logs are indexed to Elasticsearch and examined with Kibana dashboards.
- Elastic Agent & Fleet (Host Visibility): Elastic Agent replaced OSSEC/Wazuh in Security Onion 2.x. Agents installed on endpoints include Windows Event Log, Sysmon, Syslog, etc. collects logs and sends them to central Elastic transmits[18][19]. Live queries can be made with Osquery integration.
- Wazuh/OSSECÂ : Used for host-based attack detection in previous versions. It is recognized in the Security Onion literature for its HIDS/RUIDS capabilities, although it does not officially include it at this time.
- TheHive : Formerly an integrated case management platform for case management, but due to license change it has been deprecated as of 2022 and replaced by the internal Cases module.
- CyberChef: "Cyber ​​kitchen" tool. It is a flexible tool that includes text decryptor, hash cracker, other forensic analysis aids. Data processing can be done automatically or manually by accessing the SOC interface.
- Sigma and YARA Rules: Security Onion offers Sigma and YARA support for general threat identification rules. Analysts can manage Suricata, Zeek, Sigma and YARA rules and review their settings with the Detections interface. It can create new detection rules or improve existing ones.
- OpenCanary: IDS-based honeypot creation tool. Security Onion fakes services with OpenCanary. It allows attackers to fall into a trap by listening to data.
- Security Tool Collection: Sguil/Squert (legacy UI), NetworkMiner, and Threat Integration options with Intel sources (STIX/TAXII, MISP, etc.) are also available. Security Onion can pull data from many third-party solutions, both in its own interfaces and through Elastic's integrations.
Thanks to this integrated toolset, Security Onion offers a complete security environment for attack detection and analysis. In summary, the platform creates a comprehensive security base by collecting network data from Suricata/Zeek and endpoint data from Elastic Agent in a single place. (Note: In newer versions, TheHive is no longer used and Wazuh support has been largely replaced by Elastic Agent.)
Log Aggregation and Correlation Features
Security Onion uses an advanced pipeline based on Elastic Agent and Logstash to collect logs from network sensors and endpoints. Network sensors (Suricata, Zeek) and syslog sources are pushed to Logstash via Elastic Agent or Winlogbeat; Logstash queues this data into Redis queues. It then reads multiple Logstash pipeline queues and writes to Elasticsearch. For example, in Standalone installation, Suricata and Zeek logs are first transferred to Logstash; From there it flows to Redis, and from there again to Elasticsearch via Logstash. Endpoint data such as Windows Event Log and Sysmon are similarly collected through Elastic Agent and enter the same flow. In this way, all log data is stored in Elastic Common Schema (ECS) format and consistent searches can be made between different sources.
Because all data is collected in Elasticsearch, analysts can cross-correlate network and endpoint data. Security Onion supports common detection rules such as Sigma and YARA rules; these rules can uncover attacks by catching anomalies or indicators in multiple log streams. For example, while examining an event in the Kibana-based SOC interface, a detailed search can be made in all log sources with the relevant IP address or user information at the same time. This forms the center of the "alertâ†'case managementâ†'hunting" workflow. Additionally, network flow identifiers such as Community ID (CoA) are helpful in correlating connections from different sensors. Thus, wider event chains can be revealed by linking the alert received in an event with another log source. All these functions can be easily managed via SOC dashboards and Detections interface.
Threat Detection and Incident Response Opportunities
Security Onion offers multi-layered threat detection capabilities suitable for both automated and analyst intervention. Signature-based attacks (snort/Suricata rules) are constantly scanned by the network with Suricata and critical alerts are generated. Zeek provides protocol-specific anomalies and metadata, while Strelka scans suspicious content for YARA signatures with file analysis.
With the combination of Elastic Agent and osquery on the host side, malware, signature matches, file integrity violations and similar events are detected. For threat hunting, security analysts can make targeted queries using the Hunt tab in the SOC interface (for example, not searching for a specific IP or file hash). Detective rules (Sigma, YARA, Snort/Suricata) are managed on the SOC's Detections page; analysts can add new rules or customize existing rules.
From an incident response perspective, all findings can be converted into cases within Security Onion. While there used to be TheHive integration, now case management is done through the platform's own Cases interface. When an alert is detected, the analyst can move this alert to the case and save all associated logs and observations. For example, when suspicious traffic is seen, it can document the relevant IP, file hash and other IOCs by creating Cases through this alert. Then, similar events are scanned in the Hunt tab, full packages are examined from the PCAP interface when necessary, and harmful contents are analyzed with CyberChef. In the last step, the level of infection is measured by performing live queries on the endpoints with osquery (e.g. searching for machines where a certain file is located). This entire process is carried out in an integrated manner with the SOC interface (Alertsâ†'Huntâ†'PCAPâ†'Cases). Thanks to ElastAlert support, user-defined custom alarms can also be created. In summary, Security Onion provides coverage with multiple detectors, both network and host focused.It detects relevant threats; facilitates monitoring, intervention and reporting with case-based workflows.
User Interface and Visualization
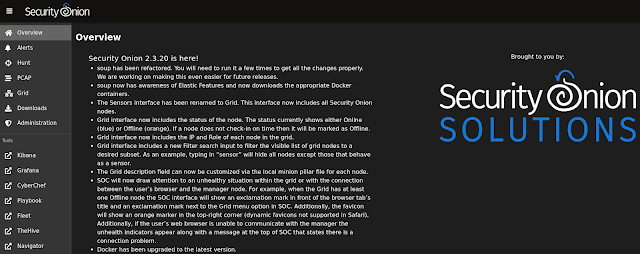
Security Onion's user interface consists of Kibana-based graphical panels called Security Onion Console (SOC). SOC basically has the following tabs:
- Alerts: Panel where all alerts from Suricata IDS are listed. Alerts are labeled according to severity level (critical, high, low, etc.) and can be analyzed with a duration filter. Metadata such as source IP/port, target, country information are seen in each alarm detail.
- Dashboards: Contains visual dashboards that summarize network metadata (Zeek DNS, HTTP logs; Suricata events; Netflow, etc.). For example, it offers indicators such as CPU/stream graphs, top source IPs or popular protocols. Thus, the overall network status and anomalies are visually monitored.
- Hunt: The section where fine-tuned queries are made. It enables in-depth searches on data in dashboards, for example, with a single IP, port or user filter. You can review an alert in the Alert tab by moving it here and use functions such as virus total search.
- Cases: Case management interface. Here you can scale what you find in Alerts or Hunt and turn it into a case, add case step notes and document the analysis stages.
- PCAP: The section where captured packages can be examined. Suspicious packets are analyzed in depth with Wireshark-like filters.
- Detections: Interface where Suricata, Zeek, Sigma and YARA rules are managed. The effectiveness of the rules is monitored and regulated.
- CyberChef: It is an integrated tab that offers data conversion and analysis tools.
- Grid / Downloads / Admin: Includes administrative panels such as node management, agent update and user management in distributed installations.
Underneath these interfaces, Kibana runs as a powerful visualization engine. Thanks to Kibana, all raw log data collected can be graphed and graphical and table-based reports can be created. Analysts can view the raw data and perform detailed search (discovery); it can also easily track down an interesting IP or hash. Saves health metrics to InfluxDB for system health monitoring in 2.x versions; The previously used Grafana interface has been removed. Therefore, performance and health data are monitored with InfluxDB queries or custom Kibana dashboards. All these visual components allow analysts to quickly grasp attacks through graphs and summary tables.
Installation and Configuration Options
Security Onion installation is done via ISO. After the installation, the system is configured with the so-setup command. There is an installation wizard that offers the user various deployment scenarios. For example, Eval mode quickly creates a test environment with a single network interface, while Standalone mode is a full-featured single server setup. In Standalone, the Logstashâ†'Redisâ†'Logstashâ†'Elasticsearch line runs. In Distributor mode, you can select manager, search and forward roles during installation. Thus, a scalable grid is created. When running Manager node, Kibana and Elasticsearch; forward nodes operate as Suricata/Zeek sensors; Search nodes contain the indexing and query infrastructure. Additionally, a desktop environment with a graphical interface can be installed using the Desktop mode.
During the installation, network interfaces are determined (such as management, sniffing) and the node role is selected. Addressing and certification settings for all components are made with SaltStack-based configuration (SO-setup). Software updates are performed with the soup command (security onion upgrade playbook). AWS/Azure marketplace images are also available; It can be quickly deployed in cloud environments using official AMI/VM images. After each installation, the status of the services can be checked with the so-status command. In distributed environments, the status of all components is monitored centrally via the Grid panel.
Daily Operational Use Cases and Scenarios
Security Onion is used in many scenarios in daily SOC operations. Sample usage flow is as follows: The analyst first reviews incoming Suricata alerts in the Alerts tab. If a suspicious IP, domain or attack signature is detected, it moves this alarm to the Hunt tab and initiates a detailed query. For example, it can examine DNS records and connection graphs for the relevant IP. Then, that traffic flow from the PCAP tab. Analyzes the raw packages of the beam. It sends a potentially harmful file it finds to CyberChef, where it decodes its content and performs hash analysis. All these findings are noted in the Cases module; The scope and steps of the event are documented. If necessary, the existence of this file is checked on all machines on the network with osquery. Ultimately, the case is closed or an action plan is created when necessary.
In daily use, the general status of the network is also evaluated by looking at the dashboard panels. For example, metrics such as top sources of daily traffic, DNS requests, suspicious URLs are reviewed. New IDS rules are written and tested on the Detections page. For automation, you can import Threat Intel data or existing vulnerability intelligence (e.g. CVEs, IOC lists) with Elastic integrations and keep it constantly updated. After installation, you can also review the system logs in Kibana Discover to monitor abnormal user movements or unsuccessful login attempts. In short, with Security Onion, all security operations are carried out on a single platform, from the morning-breakfast routine to the end of attack analysis. In a typical threat hunting scenario, the SOC tool Waterfall workflow from alarm detection to case closure proceeds as follows: Hunt â†' PCAP â†' CyberChef â†' Cases[29]. With this integrated workflow, analysts can quickly resolve incidents without having to switch between multiple tools.
Advantages and Limitations
Advantages: The biggest advantage of Security Onion is that it is free and open source. Provides access to powerful security tools without commercial license fees. It contains "best-of-breed" components such as Suricata, Zeek, Elasticsearch. It is relatively easy to deploy thanks to the installation wizard and the wealth of Documentation. Both network and endpoint monitoring are combined on a single platform. There is a very large user community and a lively support forum; Active documentation updates are made. Rules and boards developed by users can be shared. Ready-made training and certification programs are available. Additionally, thanks to its modular architecture, it can be scaled from small offices to large corporate structures. Regular updates are released with feedback from the community.
Limitations: However, Security Onion also has some limitations. Resource needs are high; At least 16â€"24 GB RAM and fast SSD disk are recommended. Installed components demand performance. It may seem complicated to use at first â€" with so many tools and interfaces combined, the learning curve can be steep. Especially management of Elastic-based components (shard, heap, scaling, etc.) requires experience. Version transitions can sometimes cause configuration differences (for example, major changes made in version 2.4 caused difficulties for some users). Additionally, for organizations that need commercial support, official help may be limited (Security Onion Solutions offers pro support, but in the free version, the dependency remains on the community). Security Onion does not have as comprehensive analytics functionality as Splunk or enterprise SIEM solutions; for example, advanced correlation engines, recordkeeping obligation management, or full corporate reporting may be limited. The discontinuation of some older integrated tools such as TheHive (internal module restrictions for case management) may also introduce additional liability.
In summary, while Security Onion offers a highly capable SIEM/NSM platform, it may require powerful hardware and experience. It must be supported with additional solutions (backup, multi-cluster, high availability) in very large or very sensitive environments. However, most of its advantages are offset by the power of the open source community.
Comparison with Similar Systems
Security Onion offers distinct differences when compared to systems such as ELK-based SIEM solutions, Splunk or AlienVault OSSIM:
- ELK Stack (Elasticsearchâ€"Logstashâ€"Kibana): ELK is a general log collector and analysis platform. Security Onion actually includes ELK components, but provides network sensor data processing and custom security interfaces by default. Sensor integration, rule management, etc. in ELK installation from scratch. Settings must be made manually. Security Onion provides ready-made configuration and NSM-oriented base. Therefore, you can think of Security Onion (SO) as an ELK distribution specialized for security.
- Splunk: Splunk Enterprise Security offers very powerful features. It stands out with its advanced and user-friendly interface, but its license cost is high. Splunk is optimized for big data analysis, but its network monitoring components in particular are not as integrated as Security Onion. While Security Onion is designed more around network traffic and open source IDSs (Suricata/Bro), Splunk works with a wider range of log types and insight. According to user comments, although Splunk is more feature-rich, Security Onion is seen as a "more cost-effective and easily deployable" option.
- AlienVault OSSIM (USM): OSSIM is an open source SIEM and security intelligence platform. It contains tools such as Snort, OSSEC, Nmap, OTX. However, OSSIM's update frequency has decreased over the years and has been criticized for its installation complexity. Security Onion provides better performance and scalability with a more modern architecture (Elasticsearch, container, etc.). It also has the advantage of extensive community support and regular updates. Some integrated vulnerability scanner and UTM features of OSSIM/USM are not directly available in SO, but SO performs similar functions with its own components.
- Wazuh : Wazuh stands out more for endpoint security and SIEM; Monitors host-based threats and provides compliance reports. Security Onion, on the other hand, is positioned as a "network-oriented" solution. As stated in a comment, "Wazuh primarily offers endpoint security and SIEM, while Security Onion is more focused on network traffic monitoring and intrusion detection." Therefore, the choice depends on your needs: SO if you focus on network-based attacks, Wazuh is preferable for endpoints and compliance.
Training, Documentation and Community Support
Extensive resources are available for learning and implementing Security Onion. The official documentation site (docs.securityonion.net) includes all features, installation steps and user guides. The README and wiki pages on GitHub also provide basic information. The regularly updated official blog (blog.securityonion.net) provides release announcements, case examples and tips.
In terms of training, Security Onion Solutions runs a variety of courses. Beginner Security Onion Essentials is available as a free on-demand course. Advanced level Production, Threat Hunting etc. courses are delivered in both online on-demand and face-to-face formats. Each course includes real-world examples and lab exercises. Additionally, a professional level expertise certificate can be obtained with the certification program (SOCP) provided by Security Onion Solutions. Online platforms also have basic Security Onion training (e.g. courses on the Cybrary platform).
Community support is strong. Problems are shared and resolved via the official forum (https://securityonion.net/discuss); The team also actively participates. Channels such as GitHub Discussions page and Slack channel are also used. As stated in the documentation, you can "share your issues in the forum (securityonion.net/discuss)". Thanks to a large user base and an active open source community on GitHub, there are plenty of sample Q&As and guides for beginners. As a result, Security Onion is made easy to use and learn thanks to robust training materials, up-to-date documentation, and vibrant community support.